WinProp

WinProp


WinProp, the main software suite of AWE Communications, is a standard software in the world of wireless propagation and radio network planning. Furthermore, all propagation models and network simulators of AWE Communications are available as plug-ins for many popular radio network planning tools and they can be integrated via their flexible APIs into any software tool of the customer.


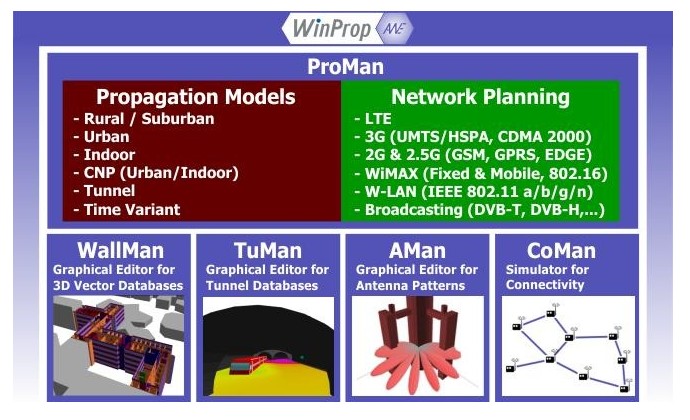
The WinProp software suite combines several programs

  • ProMan – Wave Propagation Models and Radio Network Planning
  • WallMan – Graphical Editor for vector databases (urban, indoor, time-variant,….)
  • TuMan – Graphical Editor for tunnel databases (databases with profiles)
  • AMan -Graphical Antenna Editor for 2D and 3D Antenna Patterns
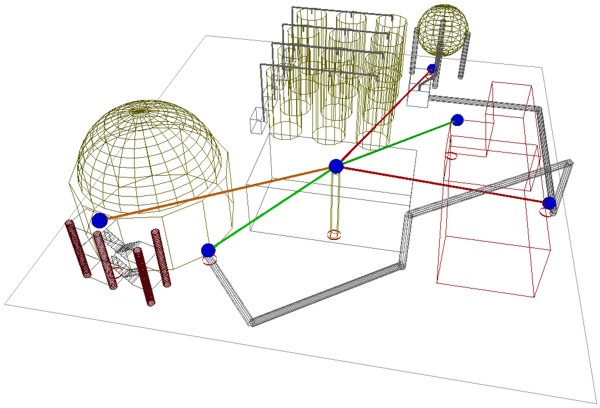
  • CoMan – Connectivity Simulator for Sensor and MESH networks


 WinProp

Atoll Microwave

Atoll Microwave

Atoll Microwave is a state-of-the-art 64-bit point-to-point and point-to-multipoint microwave link planning and optimisation software. It allows designing large microwave link networks, according to ITU recommendations, industry standards, and operator-specific design guidelines.

Atoll Microwave is based on the leading Atoll platform which includes a high performance GIS and advanced data and user management features. Atoll Microwave can share the site database with Atoll radio planning and optimisation modules allowing easy data consistency management across the operator organisation.

Atoll Microwave 3.2 includes a new ‘Backhaul Capacity Planning’ module that allows network operators to model backhaul network topologies and to dimension backhaul links according to the mobile network traffic. The Backhaul Capacity Planning module enables the analysis of end-to-end mobile traffic routing and the optimisation of backhaul capacity. Full integration of Atoll Microwave with Atoll radio planning modules allows immediate sharing of radio planning and optimisation data for backhaul dimensioning.

Atoll Microwave is being used by a number of major wireless operators and equipment vendors worldwide.


GIS Features

  • Optimised cartographic data management features with support of digital elevation models, clutter data (type and height), 3D building data (vector/raster), traffic data, scanned maps, vector data, population, and climate data
  • Integrated cartography editor (vector/raster)
  • Interface with GIS tools: MapInfo, ArcView, Google Earth
  • Support for Web Map Services (WMS) and online maps (Google, Bing, Open Street Maps, etc.)


User and Database Management

  • Advanced administration module supporting data access and user privilege management
  • Flexible database structure allowing integration of user-defined parameters and custom fields
  • Multi-user support including database consistency management, data synchronisation, and user disconnection/reconnection from/to the database
  • Support for standalone, centralised, distributed configurations
  • Advanced import/export features allowing quick data migration from other radio planning software


Task Automation

  • Scripting language allowing integration of user-defined macros
  • User-defined calculation batch based on macros and scripts


Reporting
Flexible report generator
User-defined reports based on macros
Export of custom reports in industry-standard formats


Link Modelling

  • Support of point-to-point and point-to-multipoint links
  • Modelling of microwave and wired transmission technologies: optical, copper links etc.
  • Support of ITU standard and user-defined frequency bands, high-low configurations, and channelisation plans
  • Equipment modelling: vendor parameters, IRF, signatures, etc.
  • Antenna modelling: vendor parameters including co- and cross-polarisation, radoms, etc.
  • Support for repeaters
  • Support for space and frequency diversity
  • Support for dual polarisation
  • Support for ATPC
  • Support for adaptive modulation


Link Design

  • LOS and inter-visibility plots
  • Path profile analysis including Fresnel zone clearance with multiple K factors
  • Propagation and link budget analysis
  • Automatic antenna height optimisation
  • Reflection point analysis and repeater design


Quality and Availability Objectives

  • Performance objectives based on ITU G-821, G-826, and G-828 recommendations
  • User-defined performance objectives and parameters


Link Performance Analysis

  • Based on ITU-R 530-8, 530-10, 530-11, 530-12, and 530-13 recommendations
  • Support for Crane, Vigants, and K-Q models
  • User-defined and ITU standard geoclimatic parameters
  • User-definable reports including multipath, rain, and obstruction fading
  • User-definable propagation model
  • End-to-end multi-hop link analysis


Interference Analysis and Frequency Planning

  • Based on ITU 452-11 and 452-12 recommendations
  • Detailed interference analysis including interferer ranking
  • Semi-automatic channel-to-link allocation
  • Analysis of low/high conflicts
  • Integration of interference impact into link reliability report
  • Evaluation of link quality vs. performance objectives


Backhaul Capacity Planning (option)

  • Modelling of backhaul network topologies and traffic routing
  • Backhaul network capacity planning and dimensioning
  • Failure scenario analysis and audit


Atoll Microwave

27Atoll Microwave 

Atoll Microwave вместе с новым модулем Backhaul Capacity Planning позволяет решать все необходимые задачи, связанные с планированием и оптимизацией транспортных сетей


Описание

Atoll Microwave – это современное решение с полной поддержкой 64-битной архитектуры, которое позволяет выполнять задачи по планированию и оптимизации радиорелейных (РРЛ) транспортных сетей (точка-точка, точка-многоточка). Возможности Atoll Mcirowave позволяют работать с большими РРЛ сетями в соответствии с рекомендациями ITU, отраслевыми стандартами, а также с учитывать специфику каждого оператора.


Atoll Microwave базируется на ведущей платформе Atoll, которая  включает высокопроизводительную ГИС, все необходимые данные и широкие возможности управления. В Atoll Microwave может использоваться та же база данных, которая используется в модулях планирования и отптимизации радиосети Atoll, что позволяет значительно сократить время и ресурмы для выполнения всех необходимых задач.


В Atoll Microwave версии 3.2 появился новый модуль – ‘Backhaul Capacity Planning’,  который позволяет операторам сотовой связи решать задачи связанные с:

  • Моделированием элементов транспортной сети
  • Маршрутизацей (routing) трафика
  • Планированием емкости, расширения транспортной сети
  • Анализом ёмкости
  • Анализом аварий в транспортной сети


Полная интеграция Atoll Microwave с Atoll’ом позволяет совместно использовать базу данных планирования и оптимизации радиосети.


Atoll Microwave используется многими крупными мобильными операторамии и производителями оборудования во всем мире.


TuMan

26TuMan

Мобильная связь востребована даже глубоко под землей, но туннели имеют сложную геометрическую структуру и именно для планирования в туннелях был создан данный продукт 


Описание

TuMan
Приложение для туннелей


Туннели имеют сложную геометрическую структуру. Сечение тоннеля может варьироваться вдоль изогнутого профиля и уровень земли туннеля (относительно моря) не всегда одинаков (т.е. туннель имеет “профиль местности”). Конечно, один туннель, кроме того, может быть разделён на несколько ветвей или некоторые ветви могут быть объединены в одно поперечное сечение.


Поэтому создание баз данных для точного описания туннелей очень сложное. Для упрощения этой задачи, программный пакет WinProp предлагает графический редактор TuMan для создания (и редактирования) проектов с туннелями.


TuMan позволяет определение различных сечений на протяжении одного тоннеля. Кроме того, для модели туннеля могут быть точно определены множественные изгибы с разными радиусами и его изогнутый профиль. Конечно, в TuMan также может быть задан и профиль местности внутри тоннеля.


Туннели, созданные с TuMan могут быть экспортированы в 3D данные в векторном формате WinProp s для дальнейшей обработки с WallMan.
Могут использоваться инструменты CAD WallMan, чтобы вставить дополнительные объекты в базы данных туннелей (напр. автомобили, поезда, знаки и др.) и они могут быть использованы для описания объектов, положение которых зависит от времени.


 tunneledit edit

В TuMan может построить изогнутый профиль туннеля.

TuMan

TuMan
Editor for tunnel scenarios

Tunnels have a complex geometrical structure. The cross section of a tunnel can vary along the curved profile and the ground of the tunnel is not flat (i.e. the tunnel has a “terrain profile”). Of course a single tunnel can additionally be split into multiple branches or some branches can be merged to a single cross section.


The generation of databases to describe accurately tunnel scenarios is therefore very complicated. To simplify this task, the WinProp software suite offers the graphical editor TuMan to generate (and modify) tunnel scenarios.


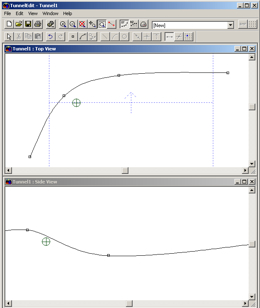
TuMan allows the definition of different cross sections within one tunnel. Additionally multiple curves with different radii can be defined to model the tunnel and its curved profile accurately. Of course the terrain profile inside the tunnel can also be defined in TuMan.


The tunnels generated with TuMan can be exported into WinProp’s 3D vector data format for further processing with WallMan.

The CAD tools of WallMan can be used to insert further objects into the tunnel databases (e.g. cars, trains, signs, etc.) and they can be used to define the time-variant behavior of the objects.


 tunneledit edit

 The curved profile of the tunnel can be defined with TuMan.

AMan

AMan – WinProp Software Suite
Graphical Editor for Antenna Patterns


Introduction

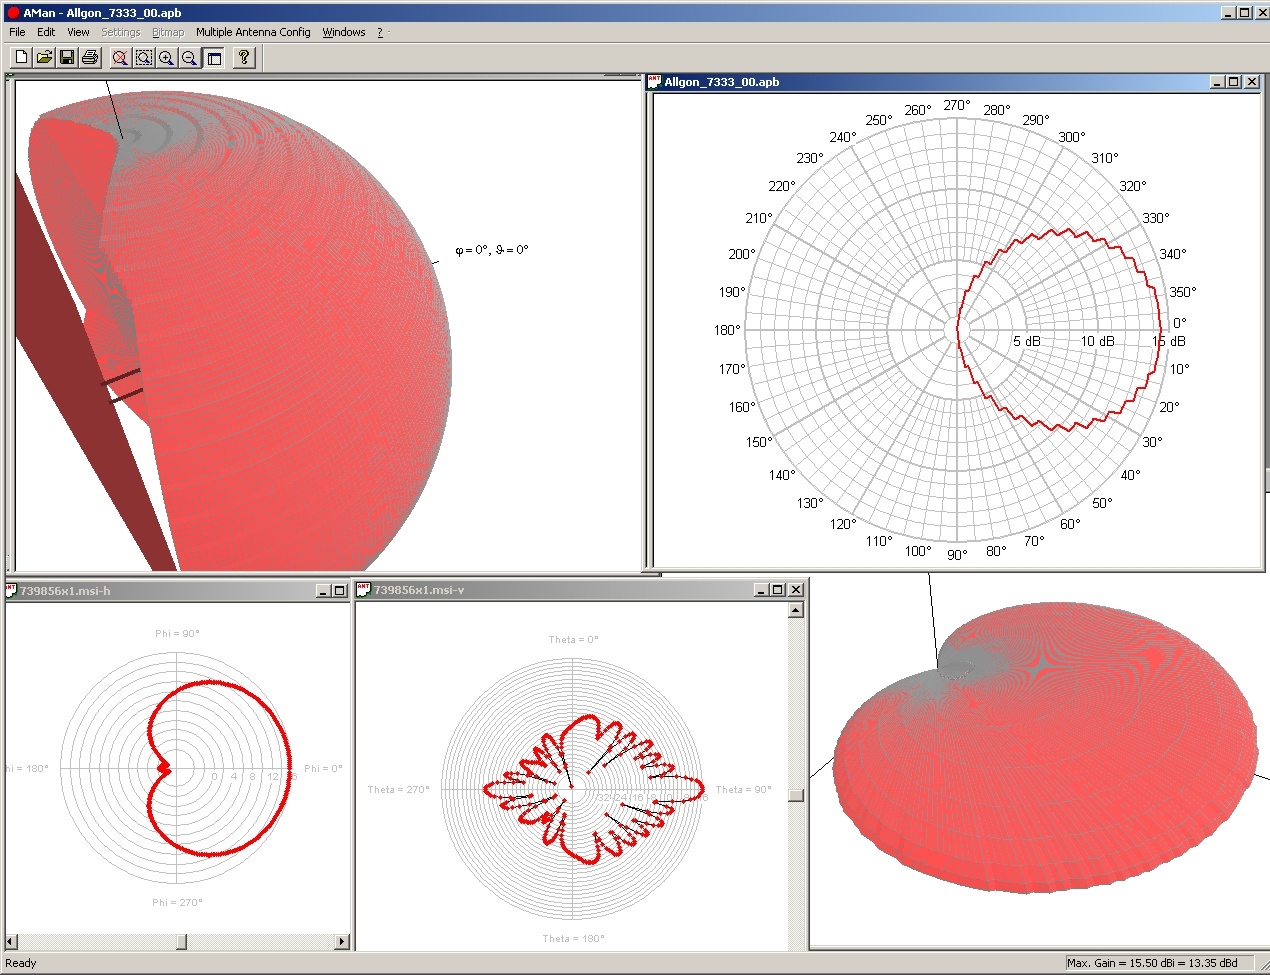
The AMan software offers a convenient facility to generate and edit antenna patterns. It is not only relevant for the interaction with other WinProp software tools because the antenna patterns can also be stored in *.xml, *.msi or further file formats – so they can be used with other radio network planning tools. Additionally antenna designers can use the software as a tool for the verification of their antenna patterns.

Besides the analysis and modification of single antennas also aMASC (Multiple Antenna Scenario Configurator) is integrated into AMan. So the supoerposition of multiple antennas radiating the same signal (incl. phase shifters and power splitters) as well as the consideration of the local environment (masts, arms, walls, sub-arms,…) can be considered to determine the actual antenna pattern.


aman large


Features of AMan

Antenna Patterns:

  • Description of the far-field of the radiation of the antenna(s)
  • At least (measured or computed) vertical and horizontal patterns are available from antenna manufacturers (in most cases also 3D pattern) describing the radiation of the antenna in ideal environments. These patterns are used as input of MASC.
  • Antenna pattern considered for computations in ProMan are always full 3D patterns. But additionally the 2x2D patterns (horizontal and vertical plane) can also be computed.

 Antennenturm1

Features:

  • 2D display of vertical and horizontal antenna patterns (with rotation, zoom,…)
  • 3D display of antenna patterns (with rotation, zoom,..)
  • Linear interpolation of antenna pattern
  • Generation of 2D vertical and horizontal antenna patterns
  • Graphical editor for 2D vertical and horizontal antenna patterns (insert, delete, modify individual points (angle and gain))
  • Display for 2D and 3D antenna pattern either with linear or with logarithmic scale
  • 2D display with scale circles (dB or linear)
  • Bitmap (with zoom) of scanned antenna pattern as background in 2D display possible (important if generation of patterns is done manually and only plots of the antenna pattern are available)
  • Exact definition of points in antenna pattern (either by mouse clicking or by dialogs)
  • Conversion of a horizontal and a vertical antenna pattern to a full 3D antenna pattern (with 4 different conversion algorithms, published in literature)
  • Print 2D or 3D antenna pattern
  • Converter for simple ASCII file formats of antenna patterns (2D and 3D patterns)
  • Converter for *.msi and *.pln antenna files (incl. interpolation from 2D to 3D)


Antenna Patterns

Antenna patterns are very important for accurate propagation modeling. WinProp is very flexible and supports a open ASCII formats for antenna patterns. If an appropriate converter for you is not already available, AWE Communications will develop the converters you need if a format description and at least one sample data set is mailed to our supportteam.


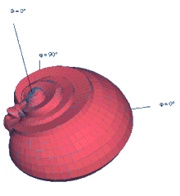
aman pattern v  aman pattern h  aman pattern 3d

Vertical plane of antenna pattern Horizontal Plane antenna pattern Interpolation of antenna pattern


Import of data

AMan offers several import filters, to convert the most popular file formats to the WinProp antenna pattern format. Popular formats are:

  • Antenna Patterns in *.msi or *.pln format

Many antenna manufacturers (e.g. Kathrein) offer digital patterns of their antennas in the *.msi and/or *.pln data format. These patterns can directly be used with all WinProp modules.

  • Open ASCII pattern format

WinProp also uses an open ASCII data format for antenna patterns – so each customer can use its own data format of the antenna patterns and can write a simple converter to the WinProp ASCII import format.


AMan

27AMan – WinProp Software Suite 

AMan – продукт, который специально разработан для создания и редактирования диаграмм направленности антенн, с большим набором необходимых функций


Описание

Программное решение AMan предоставляет удобный механизм для создания и редактирования диаграммы направленности антенны. Оно актуально не только для взаимодействия с другими WinProp программные средствами: диаграммы направленности антенн также могут быть сохранены в *.xml, *.msi или прочие форматы файлов, поэтому они могут быть использованы с другими инструментами по радиопланированию сети. Кроме того, редакторы антенн могут использовать программное обеспечение в качестве инструмента для проверки ДН их антенны.


Кроме анализа и модификация одной антенны, в AMan интегрирован также aMASC (Конфигуратор Сценария Антенн с управляемой диаграммой направленности (beamforming)). Поэтому для определения фактической направленности антенны учитываются как суперпозиция нескольких антенн, излучающих один и тот же сигнал (включая фазовращатели и делители мощности), так и местные условия (мачты, постройки, стены и т.д.)
 

aman large


Возможности AMan

Диаграмма Направленности (ДН) Антенны:

  • Описание дальней зоны излучения антенн(ы)
  • От производителей антенн доступны по крайней мере ДН в вертикальных и горизонтальных плоскостях (измеряемые или вычисляемые), описывающие излучение антенны в идеальных условиях. В большинстве случаев также имеется 3D-модель. Эти ДН используются в качестве входных данных для MASC.
  • Диаграмма направленности антенны, рассматриваемая для вычислений в ProMan, всегда в 3D виде. Но кроме того также могут быть вычислены 2x2D ДН (горизонтальной и вертикальной плоскости).
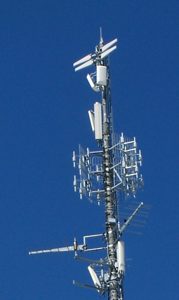
 Antennenturm1

Возможности:

  • 2D отображение ДН антенны в вертикальной и горизонтальной плоскостях (поворот, масштабирование,…)
  • 3D отображение ДН антенны (поворот, масштабирование,..)
  • Линейная интерполяция ДН антенны
  • Формирование 2D диаграммы направленности антенны в вертикальной и горизонтальной плоскостях
  • Графический редактор для 2D ДН антенны в вертикальной и горизонтальной плоскостях (вставить, удалить, изменить отдельные точки (отклонение от главного направления и усиление))
  • Отображение в 2D и 3D виде ДН антенны, либо на линейной или на логарифмической шкале
  • 2D-отображение на круговой шкале (дБ или линейная)
  • Растровые изображения (масштабируемые (zoom)) интересующих ДН антенны в качестве фона доступны в 2D отображении (важно, если формирование диаграмм направленности производится вручную и имеются только участки диаграммы направленности антенны)
  • Точное определение точек диаграммы направленности антенн (либо щелчком мыши, либо с помощью диалоговых окон)
  • Конвертация горизонтальной и вертикальной диаграммы направленности антенны в полную 3D диаграмму направленности антенны (с 4 различные алгоритмы преобразования, опубликованных в литературе)
  • Печать 2D или 3D диаграмм направленности антенны
  • Конвертер для простых форматов ASCII файлов диаграмм направленности антенн (2D и 3D моделей)
  • Конвертер *.msi и *.pln форматов представления ДН (включая интерполяцию от 2D к 3D)


Диаграммы направленности антенн

ДН антенны очень важна для аккуратного моделирования распространения. WinProp является очень гибкой и поддерживает открытые ASCII форматы для ДН антенны. Если соответствующий конвертер для вас не доступен, AWE Communications разработает преобразователи, которые вам нужны, если вы пришлёте на почту техподдержки supportteam описание формата, и хотя бы один пример данных в этом формате.
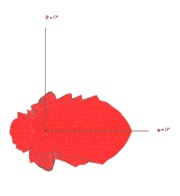
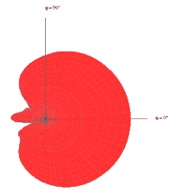
 

aman pattern v  aman pattern h  aman pattern 3d

ДН в вертикальной плоскости ДН в горизонтальной плоскости Интерполированная ДН 


Импорт данных

AMan предлагает несколько фильтров для импорта, чтобы конвертировать большинство популярных форматов файлов с ДН антенны в формат WinProp. Популярными форматами являются:

  • ДН антенна в *.msi или *.pln форматах.

Многие антенны производителей (напр. Kathrein) предлагают цифровые структуры своих антенн в *.msi и/или *.pln форматах данных. Эти структуры могут непосредственно использоваться со всеми WinProp модулями.

  • Открытые таблицы ASCII формате.

WinProp также использует открытый ASCII формат данных для диаграмм направленности антенн – так что каждый пользователь может использовать собственный формат данных диаграммы направленности антенны и может написать простой конвертер к WinProp ASCII формату импорта.



CoMan

26CoMan

Решение, созданное специально для моделирования беспроводных сенсорных (WSN) и MESH сетей с разными типами узлов и различных средах


Описание

Приложение CoMan является частью пакета WinProp и позволяет моделировать связь между узлами в беспроводных mesh/сенсорных сетях. Приложение предоставляет возможности для моделирования беспроводных сенсорных сетей с разными типами узлов, например, стандартными и gateway узлами. Связь между узлами сети может быть спрогнозирована на основе сценария распространения в различных средах (сельская местность, город и indoor). В зависимости от указанного беспроводного интерфейса системы, рассматривается также интерференция.
Пути потока информации между узлами сети могут быть определены в зависимости от состояния радио каналов между узлами и требованиями воздушного интерфейса.


CoManGUI


Возможности

  • CoMan предлагает множество функций для моделирования, прогнозирования и оценки беспроводных сенсорных сетей:
  • Визуализация местности, где моделируются сельские, городские и indoor сети в 2D и 3D видах
  • Диалоги и эргономичные инструменты для простоты моделирования беспроводной mesh/сенсор сети
  • Графические файлы (напр. отсканированную карту города или карту здания) можно поставить в фоновом режиме, для более удобной навигации и размещения узлов
  • Прогнозирование распространения волн
  • Моделирование связь между узлами в беспроводных mesh/сенсорных сетях
  • Поддержка нескольких процессоров
  • Результат можно наблюдать через браузер
  • Простота оценки ожидаемых результатов
    • Графическое представление с соответствующей легендой в 2D и 3D виде
    • анализ пороговых значений
    • экспорт в ASCII файлы


samplePredictionAreaMultiFloorsampleConnectivity


CoMan

CoMan
Software for the simulation of reliability and connectivity in wireless sensor networks


Introduction

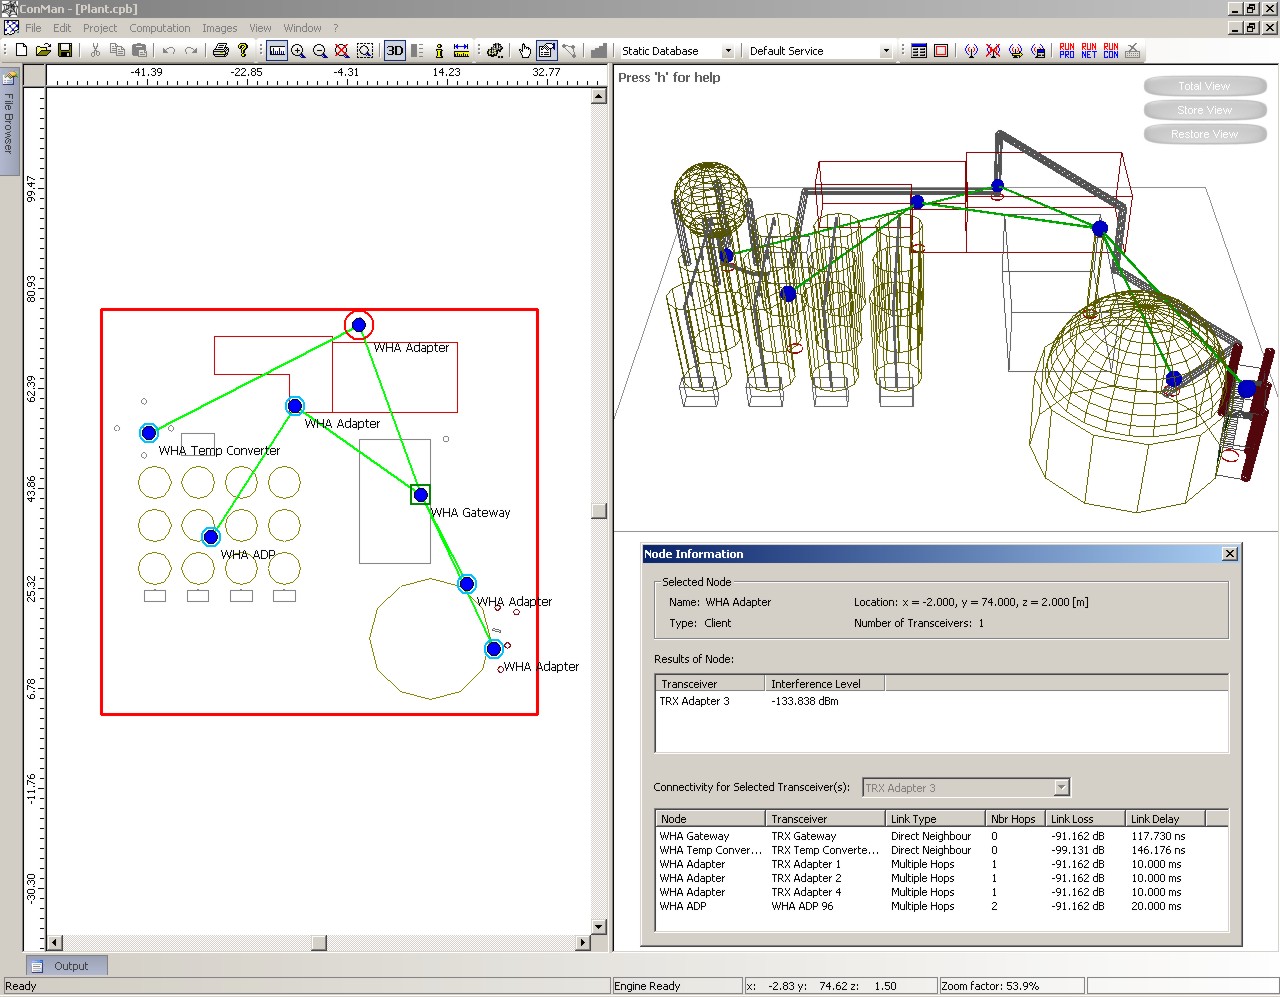
The CoMan application is part of the WinProp suite and allows the simulation of the reliability and connectivity in wireless mesh/sensor networks. The application provides the possibility to model wireless sensor networks with different types of nodes, e.g. standard and gateway nodes. Connectivity aspects between the nodes of the network can be predicted based on the underlying propagation scenario in different environments (rural, urban and indoor). Depending on the specified wireless air interface of the system, interference is considered as well. The paths of the information flow between the nodes of the network can be determined depending on the predicted radio channels between the nodes and the specified service requirements of the air interface.


CoManGUI


Features

  • CoMan offers many features to model, predict and evaluate wireless sensor networks:
  • Display of rural, urban and indoor simulation environments in 2D and 3D view
  • Dialogs and mouse tools for easy configuration of the wireless mesh/sensor network
  • Image files (e.g. scanned map of the city or map of the building) can be put in the background for easy navigation and placement of nodes
  • Prediction of wave propagation
  • Simulation of reliability and connectivity in mesh/sensor networks
  • Support of multiple CPUs
  • Result browser
  • Easy evaluation of predicted results:
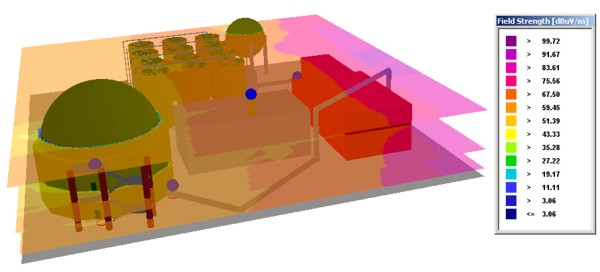
    • Graphical representation with corresponding legend in 2D and 3D view
    • Threshold analysis
    • Export to ASCII files


samplePredictionAreaMultiFloorsampleConnectivity


DAP

Distributed Active Probing (DAP)

dap logo


DAP description


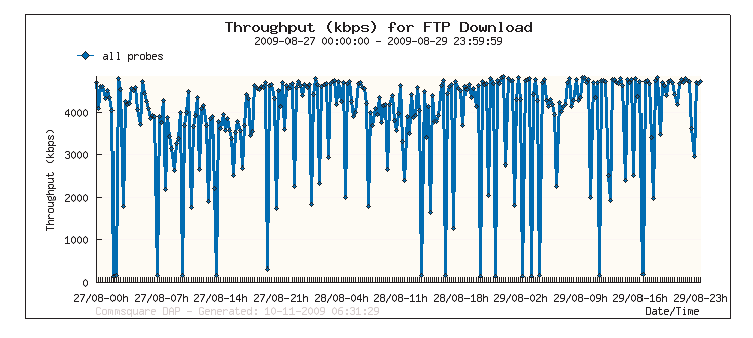
DAP is designed to monitor and measure the end-to-end performance of your mobile data services and mobile data network 24/7.
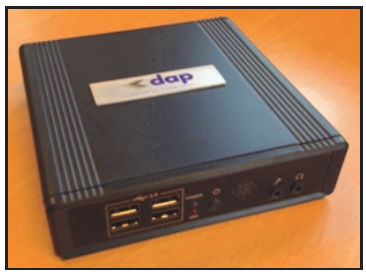
Commsquare’s DAP is a very cost-effective, unattended and distributed active test solution. The DAP probes can be deployed fast, are easy to operate and have a small form factor.
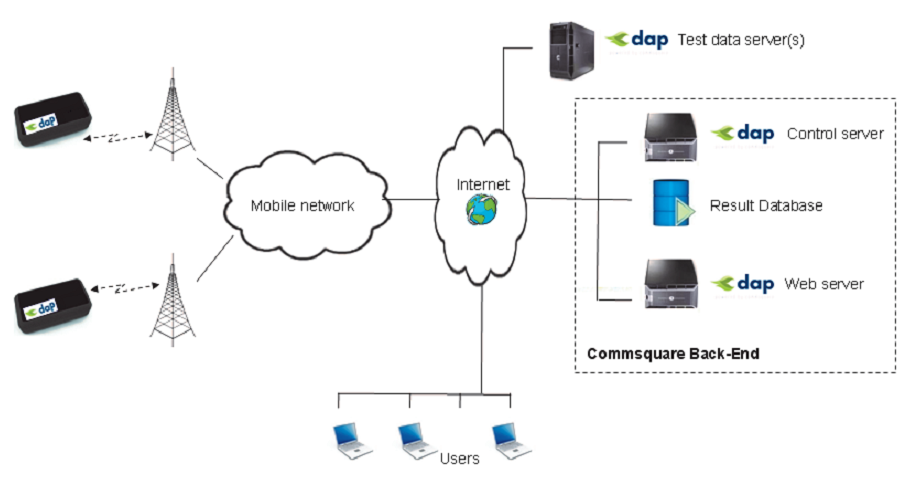
Commsquare’s Distributed Active Probing (DAP) solution consists of active test robots (i.e. small devices operating as a test computer with a cellular data modem) and the Commsquare back-end infrastructure, providing web-based reporting on relevant KPIs.

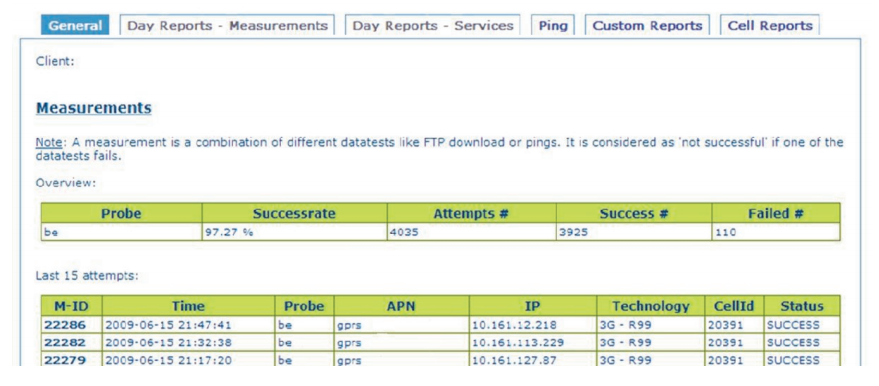
dap screenDAP probes have a small form factor and only need power to operate. The control server centrally controls the probes “over the air” and test scripts are remotely configurable. DAP probes upload the KPIs of the tests into the result database server. Users can view results through a web server.
 

Usage Model
DAP probes are typically deployed at 10’s of locations across your network.
By deploying DAP probes in each RNC and SGSN area and by testing different APNs, you will get an insight in which network elements suffer (operational) problems. You can also install a number of DAP probes in the network of your main roaming partners.
You can deploy a DAP probes at the premises of key customers to monitor SLAs; or you can send DAP probes to customer sites for trouble shooting purposes.
The auto-refresh capability of the web pages makes DAP an effective dashboard for your Network
Operations Center.


Benefits of DAP

Fast deployment
Our DAP solution can be made operational rapidly. As a Mobile Operator you just need to decide
about the local of the DAP units, deploy them and provide them with power. Commsquare will
host and run the back-end database and web server for you.


Easy to operate
The DAP probe has been engineered to be easily installed at key locations:

  • Only power required
  • Over-the-air control (no need for RJ45 connection)
  • Automatic start after power-on
  • Autonomous, fully unattended solution
  • Small form factor
  • Remotely control through the web interface


Near real-time results
As soon as the DAP probe has completed another test run, it will upload the results to the central database server. The user can then view the results without delay.


dap 1


Competition spy
DAP probes can hold SIMs from different networks. DAP can be used to compare performance of your competition 24/7. This is important to get a true picture of mobile data performance . Indeed, drive tests are often only conducted during business hours and periods of poor data performance usually don’t coincide with business hours.


Web-based results
Results can be viewed from anywhere, anytime.
Typical questions answered by DAP are:

  • Is my network running in an optimal way?
  • How does performance evolve during the day (i.e. day profile)?
  • What is the effect of mobile data growth on performance?


dap 2

Remotely control via the web interface
Using the web interface it is possible to change the APN, the name of the probe and to create/
adapt the test sequences to your needs.


Over the air update

The ‘over–the-air’ update feature facilitates the software remote upgrade of the DAP probes.
In this way the new features can easily be deployed, without any on-site intervention.

dap arch